Complete Guide: Expense Ratio Calculator — See How Investment Fees Erode Long-Term Returns
Calculate how mutual fund and ETF fees erode returns over time. Compare high-cost vs low-cost funds and see dollars lost to fees.
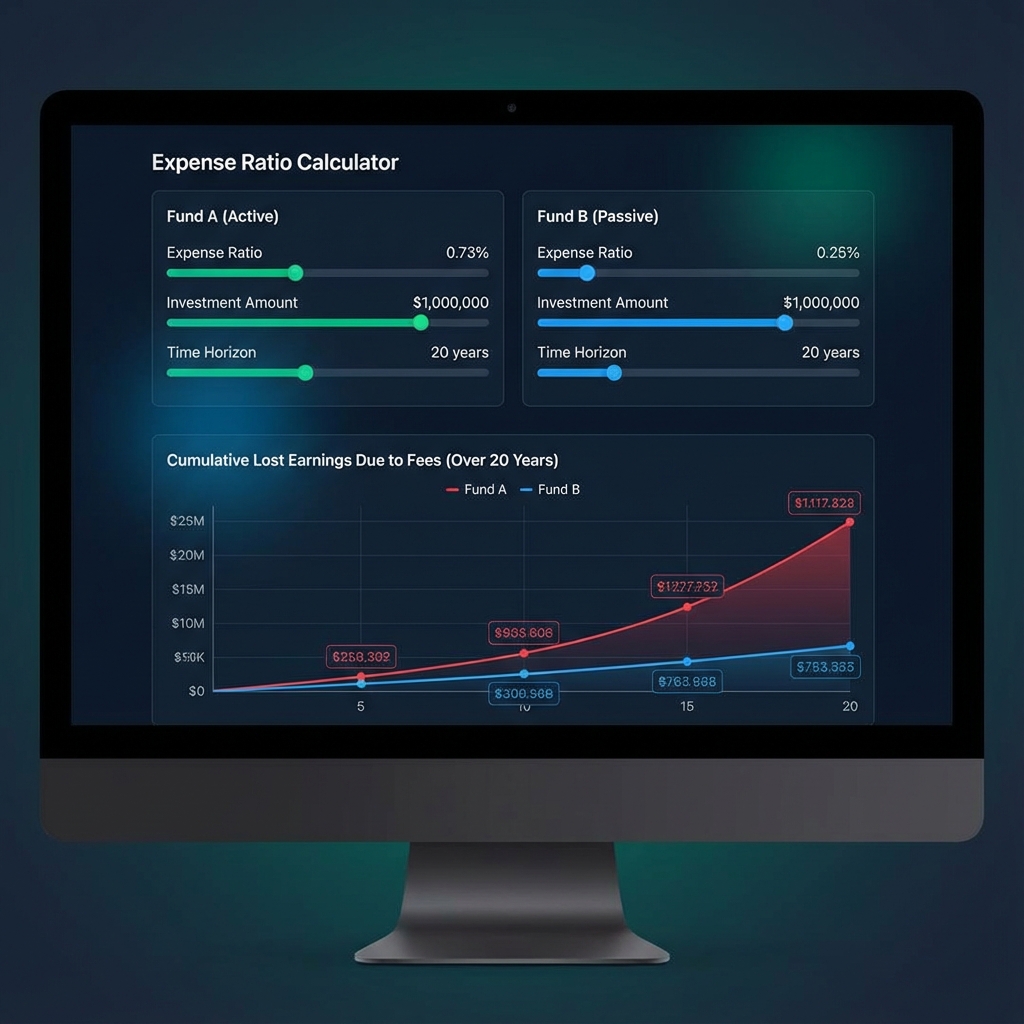
This investment & retirement tool is designed to make the cost of fund fees visible in dollars rather than just percentages. By comparing your portfolio growth with a lower-cost alternative, you can see how much of your long-term growth may be eaten up by annual fees and how much more you could keep by choosing a more efficient fund.
What is an expense ratio and how does it work?
An expense ratio is the ongoing annual fee that a mutual fund or ETF charges to cover management, administration, and other operating costs. The fee is expressed as a percentage of the assets you have invested and is deducted from the fund's returns before they show up in your account. For example, if a fund earns 7% before costs and has an expense ratio of 1.0%, your net return is closer to 6.0% after fees.
Although a difference of half a percent may sound small in a single year, it compounds over time. Every dollar paid in fees is a dollar that is no longer earning future returns. Over decades of investing, these small annual reductions can add up to very large differences in your ending balance.
How this expense ratio calculator estimates fee impact
The calculator projects your portfolio growth using an expected annual return before fees and the expense ratios you enter. It creates three scenarios:
- A no-fee baseline that assumes you keep the full market return without any fund expenses.
- Your current fund using its stated expense ratio to show how ongoing fees affect your net growth.
- A lower-cost alternative fund with a smaller expense ratio for comparison.
By running all three projections side by side, the calculator shows how much you contribute over time, how large your balance could be with no fees, and how much value is lost to fees under each fund option. The difference between the current fund and the low-cost fund is the extra wealth you might keep by reducing ongoing fund costs.
Step-by-step: how to use the expense ratio calculator
- Enter your current balance or initial investment amount in the starting balance field.
- Add your expected monthly contribution so the calculator can model ongoing investing.
- Choose a realistic annual return based on your asset mix and time horizon.
- Look up the expense ratio for the fund or ETF you currently own and enter it as your current fund fee.
- Enter the expense ratio for a lower-cost index fund or alternative you are considering.
- Run the calculation and review the projected balances, total contributions, and dollars lost to fees.
You can adjust any of the inputs to see how more aggressive contributions, longer time horizons, or different fee levels change the gap between the scenarios. This helps you build intuition about how sensitive long-term results are to small tweaks in costs and behavior.
Interpreting the charts and key metrics
The summary cards highlight your projected ending balances for each scenario and the total dollar amount lost to fees relative to a zero-fee baseline. This makes it easier to answer questions such as how much more you might have at retirement if you reduce your fund expenses today.
The chart shows three lines over time so you can see the gap gradually widen between no-fee growth, your current fund, and the low-cost alternative. The space between the lines represents the compound effect of fees. When the lines diverge significantly in later years, it is a sign that the fee difference is having a meaningful impact on your long-term wealth.
Remember that the calculator uses simplified assumptions and does not predict future market performance. Instead, it illustrates how different fee levels would have affected a hypothetical investment path under the return you selected.
Common mistakes investors make with expense ratios
- Focusing only on recent performance and overlooking how much of that return is lost to fees.
- Comparing funds with very different strategies instead of first finding low-cost options in the same category.
- Assuming a fee that looks small in percentage terms will not matter over a long time horizon.
- Holding multiple high-cost funds that all track similar benchmarks, effectively paying the same fees several times.
- Ignoring the impact of fees in tax-advantaged accounts, where you may hold investments for decades.
Using a calculator that converts percentage fees into real dollar costs can help you avoid these mistakes. When you see how much wealth is at stake, it becomes easier to prioritize fund costs alongside asset allocation and risk level.
The "Hidden" Fees: What else are you paying?
The expense ratio is the main fee, but it's not always the only one. When evaluating a fund, looking at the "Total Cost of Ownership" is vital.
Some mutual funds charge a "Front-End Load" (often 5.75%) just to buy in, or a "Back-End Load" when you sell. Avoid these. There is almost never a reason to pay a sales load in 2025 given the availability of no-load index funds.
These are marketing fees passed on to you. They are usually included in the expense ratio but represent money used to advertise the fund, not manage it. Index funds rarely have these.
Active vs. Passive Funds: The Cost Difference
The biggest driver of expense ratios is the fund's strategy.
- Active Funds (Avg Expense: 0.60% - 1.50%): Managers try to "beat the market" by picking specific stocks. Research shows that over 80-90% of active managers fail to beat their benchmark over a 10-15 year period, yet they charge 10x more than index funds. See this SEC bulletin on mutual fund fees.
- Passive/Index Funds (Avg Expense: 0.03% - 0.20%): These funds simply buy all the stocks in an index (like the S&P 500). Because there is no expensive research team or frequent trading, the costs are rock bottom.
Mutual Funds vs. ETFs: Which is cheaper?
Exchange-Traded Funds (ETFs) have surged in popularity, largely due to tax efficiency and lower costs.
| Feature | ETF | Mutual Fund |
|---|---|---|
| Trading | Trade like stocks throughout the day. | Trade once a day at market close. |
| Minimums | Price of 1 share (often ~$50-$400). | Often $3,000 minimum (Vanguard) or similar. |
| Tax Efficiency | High (Rarely pass capital gains). | Lower (Pass capital gains to you). |
| Expense Ratio | Typically Lower. | Can be low (Admiral Shares) but often higher. |
Imagine you invest 10,000 dollars today, add 500 dollars per month, and expect a 7% annual return before fees over 30 years. One fund charges a 0.80% expense ratio, while a similar index fund charges 0.05%. The calculator will show that both funds benefit from compounding, but the low-cost option ends up significantly higher because less of the return is deducted each year.
The exact numbers will depend on your inputs, but it is common to see a difference of many tens of thousands of dollars between the two scenarios. That gap is the price of higher ongoing fees, and the calculator makes that trade-off visible in a clear, intuitive way.
Once you have run a few scenarios, you can use the insights to discuss options with a financial professional or to review your current lineup of funds. For many long-term investors, aligning the portfolio with low-cost, diversified funds is one of the most effective ways to improve the odds of reaching important goals without taking on unnecessary risk.
This calculator is an educational tool and does not provide personalized investment advice. Always review fund documents carefully and consider speaking with a qualified financial professional before making major investment changes.