Understanding Inflation: The Silent Wealth Killer
If you put $100 under your mattress in 1990, today it would still be a $100 bill—but it would only buy about $40 worth of goods. That invisible disappearance of value is inflation. It’s the single biggest threat to long-term wealth that most people ignore until it's too late. To see how much you need to save, check out the savings goal calculator.
What Actually Is Inflation?
Inflation isn't just "prices going up." It is the persistent decline in the purchasing power of money. When the supply of money grows faster than the supply of goods and services, each individual unit of currency becomes less valuable.
Think of it like watering down soup. If you have a pot of soup (the economy) and you pour in gallons of water (more money) without adding more vegetables (goods), every spoonful you eat is less nutritious (less valuable). You need to eat more spoonfuls just to get the same nutrition.
The Rule of 72: How Fast Does Value Disappear?
A quick mental trick to understand inflation's impact is the Rule of 72. Divide 72 by the annual inflation rate to see how many years it takes for prices to double (or your money's value to halve).
- At 2% inflation: Prices double every 36 years.
- At 4% inflation: Prices double every 18 years.
- At 8% inflation: Prices double every 9 years.
Reality Check: If you are planning for a 30-year retirement, even "low" inflation of 3% means prices will nearly triple by the time you are done. Your $50,000/year lifestyle today will cost nearly $122,000/year in 30 years.
What Causes Inflation?
Economists generally interpret inflation as a result of the money supply increasing faster than economic output. This can happen through several mechanisms:
- Demand-Pull Inflation: This occurs when "too much money is chasing too few goods." If consumer demand outpaces the available supply (as seen with cars and electronics in 2021), prices rise.
- Cost-Push Inflation: When the cost of production increases (e.g., oil prices spike or wages rise), businesses pass these costs on to consumers in the form of higher prices.
- Monetary Expansion: When a government prints more money (or lowers interest rates to encourage lending), it increases the liquidity in the system. While this can stimulate growth, it often leads to currency devaluation.
The Consumer Price Index (CPI) Explained
The Consumer Price Index (CPI) is the most widely monitored inflation indicator. Published monthly by the Bureau of Labor Statistics (BLS), it measures the average change in prices paid by urban consumers for a market basket of goods and services.
This "basket" includes thousands of items grouped into 8 major categories:
The CPI is crucial because it dictates tax bracket adjustments (COLAs) for Social Security, tax deductions, and many union contracts.
Hyperinflation: When Money Dies
While 10% inflation is painful, hyperinflation is catastrophic. This occurs when inflation exceeds 50% per month. The most famous example is Germany in 1923, where a loaf of bread that cost 250 marks in January cost 200,000 million marks by November.
More recently, Zimbabwe (2008) and Venezuela (2018) experienced hyperinflation where prices doubled every few days. This usually happens when a government completely loses fiscal discipline and prints money to pay its debts, causing a complete loss of confidence in the currency.
Who Is Hurt Most by Inflation?
Inflation does not affect everyone equally. It creates winners and losers in the economy:
The Losers 👎
- Savers: Cash loses value daily.
- Fixed Income Retirees: Pensions buy less every year.
- Lenders: They get paid back with cheaper dollars.
The Winners 👍
- Debtors: Fixed-rate mortgages become "cheaper" to pay off.
- Asset Owners: Real estate and stocks typically rise with inflation.
- Governments: They can pay off huge debts with inflated currency.
3 Strategies to Beat Inflation
You cannot stop inflation, but you can outrun it. Here is how smart investors protect their purchasing power:
1. Own Real Assets
Tangible assets like real estate, commodities (gold/silver), and land tend to appreciate alongside inflation. If lumber and labor costs go up, so does the replacement cost of your home.
2. Invest in Equities (Stocks)
Companies can raise prices to match inflation. If Coca-Cola's costs go up, they raise the price of a can of Coke. This boosts their revenue and (ideally) their stock price. Historically, the S&P 500 has returned about 10% annually, well above the 3% average inflation rate.
3. Maximize Fixed-Rate Debt
If you have a 30-year fixed mortgage at 4%, and inflation hits 6%, the bank is effectively paying you to borrow money in real terms. You are paying back the loan with dollars that are worth less than the ones you borrowed.
The Personal Inflation Rate
The official CPI is an average. Your personal inflation rate might be totally different. If you have a fixed-rate mortgage (locking in your biggest housing cost) and you don't commute (saving on gas), your personal inflation rate might be 2% while the national average is 6%.
Conversely, if you rent in a hot market, have a long commute, and eat out frequently, your personal rate could be 10%+. Understanding your specific basket of goods helps you plan a budget that reflects your reality, not just the national average.
The Phillips Curve: Inflation vs. Unemployment
Historically, economists believed in a trade-off: you could have low inflation OR low unemployment, but not both. The logic was that high employment drives up wages, which drives up demand and prices.
Stagflation: The Nightmare Scenario
In the 1970s, this theory broke down when the US experienced "Stagflation"—stagnant economic growth, high unemployment, AND high inflation. It is the worst of all worlds. Central banks fear this most because the usual tools (raising rates to kill inflation) make unemployment worse.
Deflation: The Opposite Problem
While inflation erodes purchasing power, deflation (falling prices) can be arguably worse for an economy. If prices are falling, consumers delay purchases ("Why buy a car now if it will be cheaper next month?").
The Deflationary Spiral
Reduced spending leads to lower business revenue, which leads to wage cuts and layoffs, which leads to even less spending. Japan battled this for decades (the "Lost Decades"). A healthy economy typically aims for a small, predictable inflation rate of around 2%.
The Role of Central Banks
The Federal Reserve (the "Fed") has a dual mandate: maximum employment and stable prices. They use interest rates as a gas pedal/brake for the economy.
- Raising Rates: Makes borrowing expensive (mortgages, business loans). This slows down spending and cools off inflation.
- Lowering Rates: Makes borrowing cheap. This encourages spending and investment, stimulating inflation and growth.
When you see "The Fed raised rates by 0.25%," they are actively trying to fight inflation by making money more expensive to "rent" (borrow).
Inflation in the 21st Century
The last two decades have been an anomaly. For most of the 2010s, the US struggled to get inflation up to 2%. Then came the 2020s.
The Post-2020 Paradigm Shift
The supply chain shocks of 2020-2022 taught us that global logistics are fragile. "Just-in-Time" inventory is being replaced by "Just-in-Case," which is inherently more expensive (inflationary). Additionally, the transition to green energy involves massive capital expenditure, coined "Greenflation." We may be entering an era where 3-4% inflation is the new normal, making this calculator more relevant than ever.
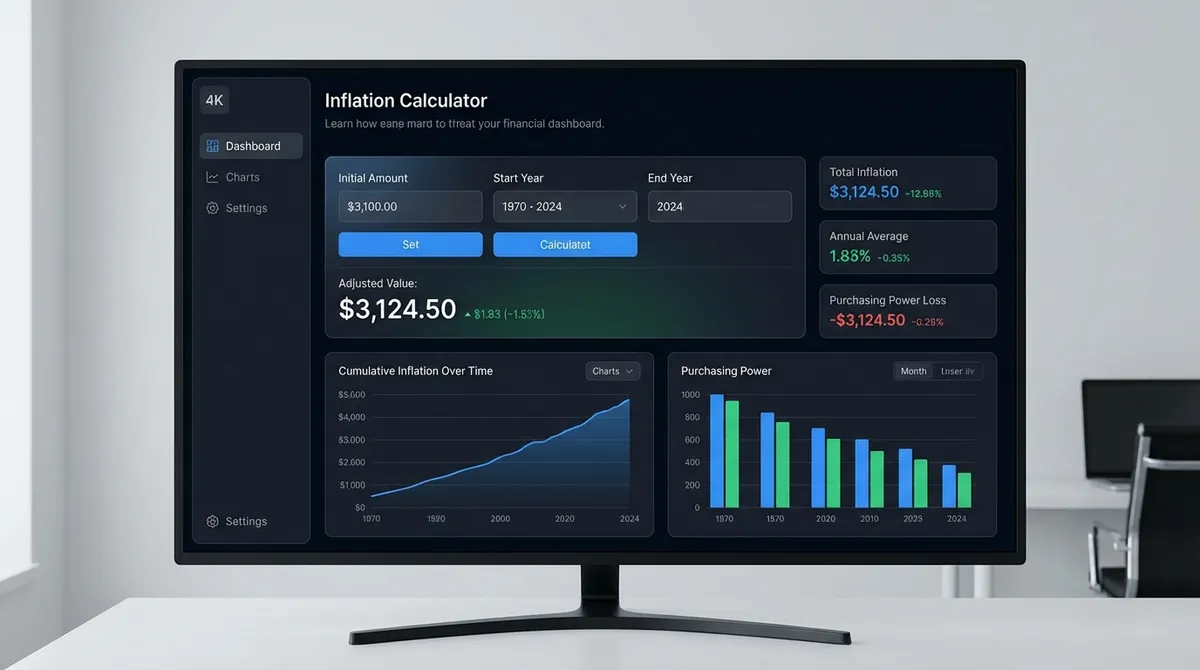
Using This Calculator
Our tool includes historical CPI data dating back to 1913. Use the "Historical Data" mode to see exactly how much purchasing power has been lost over specific periods (like since you were born). Use the "Custom Rate" mode to project future scenarios—essential for retirement planning.