Complete Guide to Inventory Turnover Ratio
What is Inventory Turnover Ratio?
Inventory turnover ratio measures how efficiently a business sells and replaces its inventory over a specific period. This crucial financial metric reveals whether a company is effectively managing its stock levels, maintaining optimal cash flow, and avoiding both overstock and stockout situations that can severely impact profitability.
The ratio calculates how many times average inventory is sold during a period. A higher ratio generally indicates efficient inventory management, while a lower ratio may signal overstocking, obsolescence, or weak sales. However, the ideal ratio varies significantly across industries, making industry-specific benchmarks essential for proper evaluation.
Why Inventory Turnover Matters for Your Business
- Cash Flow Optimization – Faster inventory turnover improves cash conversion cycles, providing more working capital for business operations.
- Reduced Holding Costs – Every day inventory sits in storage costs money through warehousing, insurance, and potential obsolescence.
- Enhanced Profitability – Efficient inventory management minimizes markdowns and write-offs while maximizing sales opportunities and operating margin.
- Better Customer Service – Optimal turnover prevents stockouts while maintaining fresh, current product offerings.
- Storage Space Optimization – Right-sized inventory reduces warehousing needs and associated overhead costs.
Inventory Turnover Formula Explained
The inventory turnover ratio formula consists of two key components:
Primary Formula:
Understanding the Components
Cost of Goods Sold (COGS)
COGS represents the direct costs associated with producing or purchasing the goods sold during the period. This includes raw materials, direct labor, and manufacturing overhead. For retailers, it's typically the purchase cost of inventory sold. COGS is found on the income statement and is crucial because it reflects actual sales activity rather than inventory value fluctuations.
Average Inventory
Average inventory smooths out fluctuations in inventory levels throughout the period. The standard calculation averages the beginning and ending inventory values:
For more accuracy, businesses can calculate average inventory using monthly values or use the average inventory method that accounts for seasonal variations.
How to Calculate Inventory Turnover Ratio
Step 1: Identify Your COGS
Locate your Cost of Goods Sold from your income statement (also called profit and loss statement). For the most recent year, ensure you're using the same period that matches your inventory values. If COGS isn't explicitly stated, calculate it as:
COGS = Beginning Inventory + Purchases - Ending Inventory
Step 2: Calculate Average Inventory
Find your beginning inventory (start of period) and ending inventory (end of period) values from your balance sheet. Add them together and divide by two to get your average inventory during the period.
Step 3: Compute the Ratio
Divide your COGS by the average inventory calculated in step 2. This gives you your inventory turnover ratio, representing how many times you sold and replaced your average inventory during the period.
Step 4: Calculate Days Sales of Inventory (DSI)
For additional insight, calculate DSI to understand how many days inventory typically sits before being sold:
Interpreting Your Inventory Turnover Results
What is a Good Inventory Turnover Ratio?
The ideal inventory turnover ratio varies significantly by industry and business model. There's no universal "good" number, but here are general benchmarks:
- High Turnover (10+ times per year) – Typical for grocery stores, fast fashion retail, and perishable goods
- Moderate Turnover (4-10 times per year) – Common for general retail, electronics, and home goods
- Low Turnover (1-4 times per year) – Normal for automotive dealerships, luxury goods, and heavy equipment
- Very Low Turnover (<1 time per year) – Typical for jewelry stores, art galleries, and specialty collectibles
High Inventory Turnover: Pros and Cons
Advantages:
- Fresh, current merchandise
- Reduced holding costs
- Improved cash flow
- Lower obsolescence risk
- Higher return on inventory investment
Potential Issues:
- Stockouts and lost sales
- Increased ordering costs
- Supply chain vulnerability
- Ordering errors from rush
- Reduced bulk discount opportunities
Low Inventory Turnover: What it Means
Low inventory turnover isn't always negative—in some industries, it's expected. However, when turnover is lower than industry standards, it may indicate:
- Excess inventory and overstocking
- Poor sales performance or weak demand
- Obsolete or outdated products
- Inefficient purchasing decisions
- Pricing issues that discourage sales
Why Inventory Turnover Matters
This ratio is a key indicator of a company's health and Working Capital efficiency.
High Turnover (Good)
Indicates strong sales or effective inventory management. The company isn't tying up cash in dead stock. This typically correlates with better Cash Flow.
Low Turnover (Bad)
Signals poor sales or excess inventory (overstocking). This can lead to obsolete goods, spoilage (for perishables), and higher storage costs.
*Note: Extremely high turnover might mean inadequate inventory levels, leading to lost sales opportunities (stockouts).
Strategies to Improve Inventory Turnover
- Demand Forecasting: Use data to predict sales trends accurately. Avoid ordering based on "gut feeling."
- Review Pricing: If items aren't moving, a strategic discount might clear the shelves and recover cash. Check your Gross Margin impact first.
- Automate Reordering: Use software to trigger reorders only when stock hits a specific low level (Safety Stock).
- Supplier Negotiation: Negotiate for smaller, more frequent deliveries to reduce carrying costs without risking stockouts.
Industry Benchmarks
Turnover rates vary wildly by industry. Comparing a grocery store to a car dealership is apples to oranges.
| Industry | Typical Turnover Ratio | Days to Sell (approx) |
|---|---|---|
| Grocery / Perishables | 12 - 20 | 18 - 30 days |
| Apparel / Retail | 4 - 6 | 60 - 90 days |
| Automotive / Sales | 2 - 4 | 90 - 180 days |
| Luxury Goods | 1 - 2 | 180+ days |
Connection to Other Metrics
Inventory turnover is a component of the "Cash Conversion Cycle" (CCC). Improving it directly impacts your bottom line operational efficiency.
Keep an eye on Operating Margin as you adjust inventory strategies—holding too little stock saves money but kills sales (and revenue).
Common Mistakes to Avoid
- Using Sales Instead of COGS – This inflates your ratio and gives inaccurate results. Always use COGS for accuracy.
- Ignoring Seasonal Variations – Businesses with seasonal patterns should use annual averages rather than single-period snapshots.
- Comparing Across Industries – A grocery store's turnover will naturally be much higher than a car dealership's. Compare against your specific industry.
- Not Considering Business Model – Just-in-time manufacturing will show different ratios than traditional mass production.
- Overlooking Inventory Valuation Methods – FIFO, LIFO, and weighted average methods can significantly impact both beginning and ending inventory values.
Practical Examples
Example 1: Retail Electronics Store
A consumer electronics retailer had beginning inventory of $500,000, ending inventory of $450,000, and COGS of $2,800,000 for the year.
Average Inventory = ($500,000 + $450,000) ÷ 2 = $475,000
Inventory Turnover = $2,800,000 ÷ $475,000 = 5.89x
Days Sales of Inventory = ($475,000 ÷ $2,800,000) × 365 = 62 days
Interpretation: The store sells and replaces its inventory 5.89 times per year, with inventory sitting for an average of 62 days before selling. This is healthy for electronics retail, where product lifecycles are relatively short.
Example 2: Automotive Parts Distributor
A wholesale auto parts distributor shows beginning inventory of $1,200,000, ending inventory of $1,100,000, and COGS of $3,600,000.
Average Inventory = ($1,200,000 + $1,100,000) ÷ 2 = $1,150,000
Inventory Turnover = $3,600,000 ÷ $1,150,000 = 3.13x
Days Sales of Inventory = ($1,150,000 ÷ $3,600,000) × 365 = 117 days
Interpretation: With 3.13 turns per year and 117 days of inventory, this is appropriate for automotive parts distribution where inventory needs to be available for immediate customer needs but products don't become obsolete quickly.
Example 3: Fresh Grocery Store
A supermarket chain reports quarterly beginning inventory of $800,000, ending inventory of $750,000, and COGS of $6,500,000 for the quarter (90 days).
Average Inventory = ($800,000 + $750,000) ÷ 2 = $775,000
Inventory Turnover = $6,500,000 ÷ $775,000 = 8.39x (quarterly)
Annualized Turnover = 8.39 × 4 = 33.56x
Days Sales of Inventory = ($775,000 ÷ $6,500,000) × 90 = 11 days
Interpretation: With perishable goods, rapid turnover is essential. An 11-day sales cycle indicates excellent inventory management for a grocery operation, balancing freshness with availability.
How to Use the Calculator Effectively
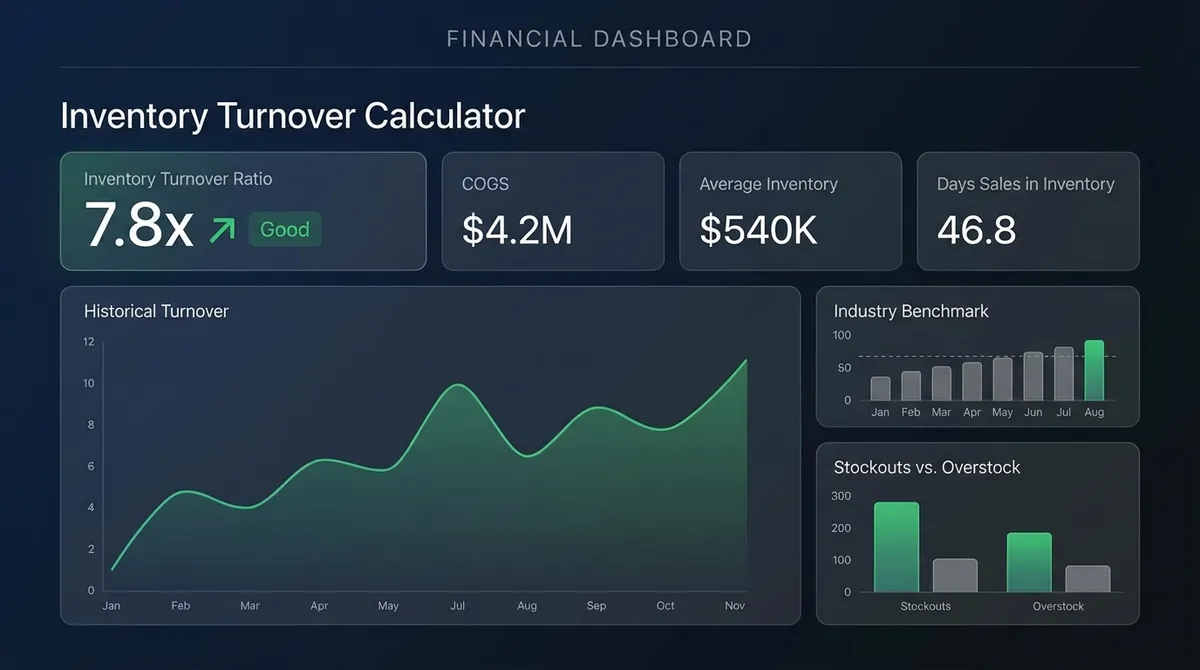
Our Inventory Turnover Calculator simplifies these calculations and provides immediate insights. Enter your beginning inventory, ending inventory, COGS, and select your time period. The calculator instantly computes:
- Your average inventory value
- Inventory turnover ratio
- Days sales of inventory (DSI)
- Industry-appropriate efficiency rating
- Visual comparisons against industry benchmarks
Strategies to Improve Inventory Turnover
If Your Turnover is Too Low:
- Implement demand forecasting to align inventory with expected sales
- Offer promotions on slow-moving items
- Negotiate with suppliers for smaller, more frequent deliveries
- Discontinue underperforming products
- Improve marketing to increase product visibility and demand
If Your Turnover is Too High:
- Increase safety stock to prevent stockouts
- Negotiate better payment terms allowing larger purchases
- Consider automatic replenishment systems
- Build supplier relationships for reliable, quick restocking
- Evaluate if stockouts are costing sales opportunities
Final Thoughts
Inventory turnover ratio is a vital metric that provides deep insights into operational efficiency, cash flow management, and overall business health. Regular monitoring—monthly for high-turnover businesses, quarterly for others—enables proactive inventory management decisions.
Remember that the "right" ratio depends on your specific industry, business model, and strategic goals. Use this calculator as a starting point for deeper analysis, comparing your performance against industry standards, tracking trends over time, and identifying opportunities for operational improvement.
Combine inventory turnover analysis with other metrics like gross margin return on investment (GMROI), sell-through rates, and stockout frequency for a comprehensive understanding of your inventory performance. This holistic approach ensures you maintain the delicate balance between product availability and capital efficiency that drives sustainable business growth. For more details, verify with Investopedia's guide on the topic.
This article was last updated on September 11, 2025 and reflects current industry standards for inventory management best practices.