Complete Guide: Understanding Mutual Fund Returns & Fees
Investing in mutual funds is one of the most popular ways to build long-term wealth, but understanding the true impact of fees and compound growth can be challenging. Our Mutual Fund Calculator cuts through the complexity, showing you exactly how your money grows and how much you're really paying for fund management.
What Is a Mutual Fund?
A mutual fund is a financial vehicle that pools money from many investors to purchase a diversified portfolio of stocks, bonds, or other securities. Instead of buying individual stocks yourself, you buy shares of the mutual fund. This gives you instant diversification and professional management.
Mutual funds are managed by professional portfolio managers who allocate the fund's assets and attempt to produce capital gains or income for the fund's investors. The portfolio is structured and maintained to match the investment objectives stated in its prospectus.
Pros of Mutual Funds
- •Diversification: Instant access to hundreds of stocks reduces risk.
- •Professional Management: Experts make buy/sell decisions for you.
- •Liquidity: You can redeem shares on any business day.
- •Accessibility: Low minimum investment requirements.
Cons of Mutual Funds
- •Fees & Expenses: Management fees reduce your returns annually.
- •Tax Inefficiency: Capital gains distributions are taxable even if you don't sell.
- •No Control: You can't choose which specific stocks to hold or sell.
- •Cash Drag: Funds must hold cash for redemptions, which may lower returns.
The Hidden Cost: Expense Ratios Explained
The expense ratio is the annual fee that mutual funds charge their shareholders. It is expressed as a percentage of assets under management. For example, if you invest $10,000 in a fund with a 1% expense ratio, you pay $100 per year.
While 1% might sound small, its impact over time is massive due to the opportunity cost. Every dollar paid in fees is a dollar that cannot compound for you in future years.
The $150,000 Difference
Consider two investors who both invest $10,000 initially plus $500/month for 30 years, earning 8% annually.
Investor A chooses a low-cost index fund (0.05% fee). Final Balance: $745,000.
Investor B chooses a high-cost active fund (1.50% fee). Final Balance: $585,000.
The 1.45% difference in fees cost Investor B $160,000 in lost wealth. That's the power of keeping fees low.
SIP vs. Lump Sum Investing
Our calculator supports both Systematic Investment Plans (SIP) and Lump Sum investments. Which is better?
Systematic Investment Plan (SIP)
SIP involves investing a fixed amount regularly (e.g., $500 monthly). This strategy benefits from Dollar Cost Averaging. When the market is down, your $500 buys more shares. When the market is up, it buys fewer. Over time, this lowers your average cost per share and reduces the risk of investing all your money at a market peak.
Lump Sum Investing
Lump sum investing means putting all your available capital into the market at once. Historically, lump sum investing outperforms SIP about 67% of the time because markets tend to rise over the long term. By investing immediately, you give your money more time to grow. However, it carries higher psychological risk—if the market crashes the next day, your portfolio value drops significantly.
Active vs. Passive Funds: How to Choose
One of the biggest decisions you'll make is choosing between actively managed funds and passive index funds.
| Feature | Active Funds | Passive (Index) Funds |
|---|---|---|
| Goal | Beat the market | Match the market |
| Management | Human managers pick stocks | Computer tracks an index |
| Typical Fee | 0.50% - 1.50% | 0.03% - 0.20% |
| Performance | Often underperforms benchmark | Consistently average |
| Tax Efficiency | Lower (more trading) | Higher (less trading) |
Tax Implications of Mutual Funds
Taxes can take a significant bite out of your returns if you hold mutual funds in a taxable brokerage account (not an IRA or 401k).
- Dividends: Most funds pay dividends, which are taxed as ordinary income or qualified dividends (lower rate) depending on the holding period.
- Capital Gains Distributions: When a fund manager sells a stock for a profit, they must distribute that gain to shareholders. You owe taxes on this gain even if you didn't sell any shares of the fund. This is a unique disadvantage of mutual funds compared to ETFs.
- Selling Shares: When you sell your mutual fund shares for a profit, you owe capital gains tax. If held for over a year, you pay the lower long-term capital gains rate (0%, 15%, or 20%).
How to Build a Winning Mutual Fund Portfolio
Building a portfolio isn't about picking the "hot" fund of the year. It's about asset allocation—dividing your money among different asset categories. Here is a simple 3-step strategy used by professionals:
1. The Core (Total Market)
The foundation of your portfolio should be a broad-market index fund, such as a Total Stock Market Index Fund or an S&P 500 fund. This gives you exposure to the entire U.S. economy at a very low cost. For most investors, this should represent 50-70% of their equity allocation.
2. International Diversity
The U.S. market doesn't always perform best. Adding an International Index Fund (Total International Stock) smoothes out volatility and captures growth in emerging markets. A common allocation is 20-30% of your portfolio.
3. Bonds for Stability
Depending on your age, you need bonds to cushion the blow when stocks fall. A Total Bond Market Index Fund is the simplest way to get exposure to government and corporate bonds. A rule of thumb is "110 minus your age" for your stock allocation, with the rest in bonds.
The "Three-Fund Portfolio"
This simple, lazy portfolio has historically outperformed most professional money managers over the long run:
- • Total US Stock Market Index Fund (60%)
- • Total International Stock Market Index Fund (20%)
- • Total Bond Market Index Fund (20%)
Understanding Sales Charges (Loads)
Beyond expense ratios, some mutual funds charge "loads," which are commissions paid to brokers. These can significantly eat into your returns.
Class A Shares (Front-End Load)
You pay a fee upfront when you buy shares. Typically 5.75%. If you invest $10,000, only $9,425 actually goes into the market. This is best for very long-term holders as subsequent fees are lower.
Class B Shares (Back-End Load)
You pay a fee when you sell shares. This fee usually decreases over time (e.g., 5% in year 1, 0% after year 6). However, these shares often have higher annual 12b-1 marketing fees.
Class C Shares (Level Load)
There is no upfront or back-end fee, but you pay a high annual 12b-1 fee (often 1%) forever. These are almost always the most expensive option for long-term investors.
The Better Option: No-Load Funds
Most modern investors and DIY platforms (like Vanguard, Fidelity, Schwab) focus on No-Load Mutual Funds. These have $0 sales commissions. Always look for "No-Load" in the fund description to avoid unnecessary costs.
Advanced Concepts: Measuring Risk
Not all 10% returns are created equal. One fund might achieve it with steady growth, while another might be a rollercoaster. Use these metrics to evaluate a fund's risk-adjusted performance:
Alpha
Measures a manager's performance against their benchmark. An Alpha of +1.5 means the manager beat the market by 1.5%. Negative Alpha means they underperformed. Most active managers have negative Alpha over long periods after fees.
Beta
Measures volatility relative to the market. The market has a Beta of 1.0. A fund with Beta 1.2 is 20% more volatile than the market (higher risk, higher potential reward). A Beta of 0.8 means it's 20% less volatile (safer).
Sharpe Ratio
This is the gold standard for risk-adjusted return. It asks: "Was the return worth the risk?" A Sharpe Ratio > 1.0 is considered good; > 2.0 is excellent. It essentially measures return per unit of risk.
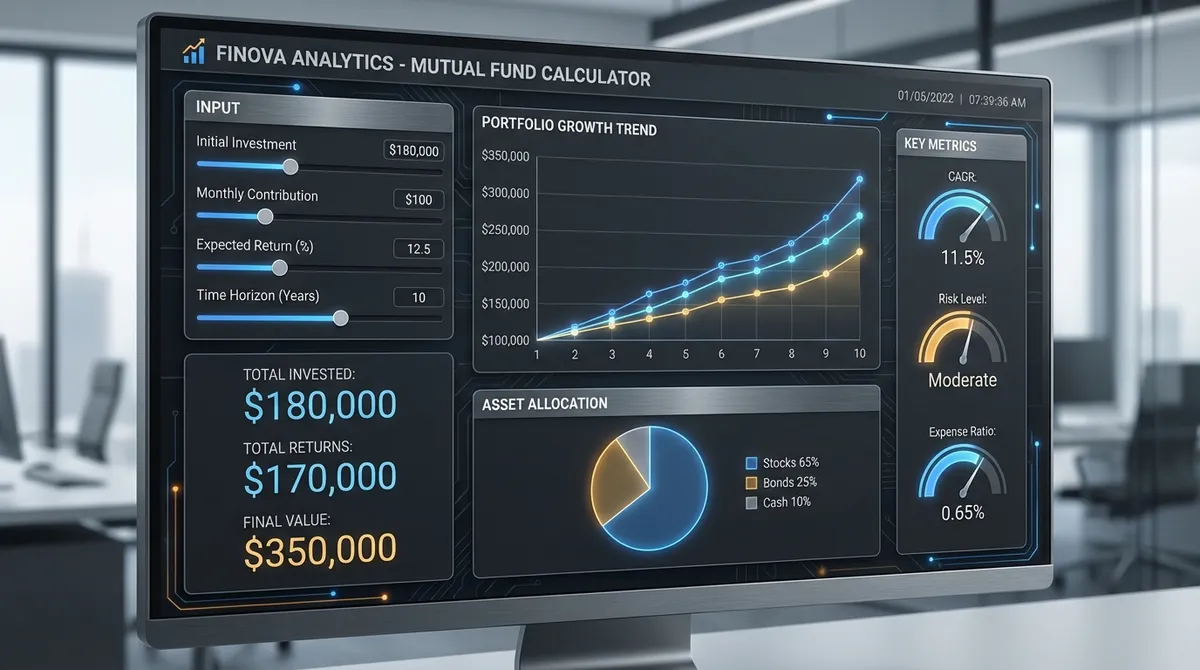
How to Use This Calculator
- Enter Initial Investment: Start with the amount you have today. If you're starting from zero, enter 0.
- Set Monthly Contribution: How much can you save each month? Consistency is key. Even $100/month adds up.
- Input Expected Return: Be realistic. The S&P 500 has historically returned about 10% annually before inflation. For a conservative estimate, use 7-8%.
- Add Expense Ratio: Check your fund's prospectus. If you don't know, use 0.05% for index funds or 0.80% for active funds.
- Review the Impact: Look at the "Fee Impact Analysis" card. This shows you exactly how much wealth you're sacrificing to fees.
Final Investment Tip
Control what you can control. You cannot control market returns, inflation, or the economy. But you can control your savings rate and the fees you pay. Focus on saving more and choosing low-cost funds to maximize your probability of success.