The Ultimate Guide to Net Operating Income (NOI)
Unlock the true potential of your real estate investments. Master the calculation of Net Operating Income (NOI) to accurately value properties, secure financing, and maximize your returns.
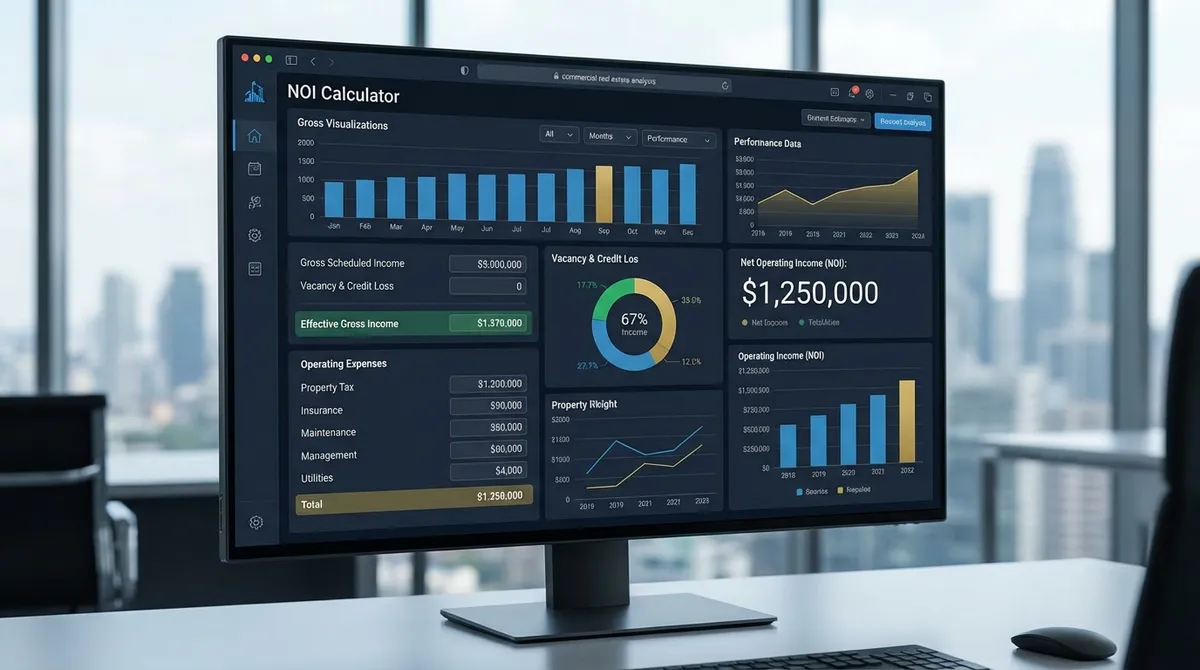
Visualizing Success
NOI Calculator - Professional Commercial Real Estate Tool
What is Net Operating Income (NOI)?
Think of Net Operating Income (NOI) as the raw horsepower of a real estate engine. It measures exactly how much cash a property generates from its core operations, completely stripping away the effects of financing (mortgage payments) and income taxes.
Whether you own a duplex, a shopping center, or a 100-unit apartment complex, NOI is the single most important metric for determining the value and health of your investment. It answers the fundamental question: "Is this property actually making money on its own merit?"
The Golden Formula
*Crucial Note: Mortgage payments (debt service) are NOT included in operating expenses.
Why NOI Matters More Than Cash Flow
New investors often confuse NOI with Cash Flow, but they are distinct tools for different jobs:
- NOI (Property Performance): Used to compare Property A vs. Property B. It ignores how you bought it (cash vs. loan) to show the quality of the asset itself.
- Cash Flow (Investor Performance): Includes your mortgage payments. It tells you how much money actually hits your bank account each month.
Step-by-Step: How to Calculate NOI Correctly
Getting an accurate NOI requires strict discipline in categorizing expenses. Here is exactly what goes in and what stays out.
Income (Include All)
- ✓ Gross Rental Income (collected)
- ✓ Parking Fees
- ✓ Laundry & Vending Machines
- ✓ Storage Unit Fees
- ✓ Pet Fees & Application Fees
Expenses (Be Selective)
- ✓ Property Management Fees
- ✓ Property Taxes & Insurance
- ✓ Utilities (paid by owner)
- ✓ Repairs & Routine Maintenance
- ✓ Landscaping & Janitorial
What to EXCLUDE (The Trap)
Never subtract Mortgage Payments (Principal & Interest), Capital Expenditures (like a new roof or HVAC replacement), or Depreciation from NOI. These belong below the NOI line in a pro-forma.
Real-World Example Breakdown
Let's say you are evaluating a 4-plex in Chicago.
- Total Rent Collected: $60,000 / year
- Laundry Income: $1,200 / year
- Vacancy Loss: -$3,000 (already accounted for in collections)
- Effective Gross Income: $61,200
Operating Expenses:
- Taxes: $8,000
- Insurance: $2,500
- Water/Trash: $3,000
- Repairs: $4,000
- Management (7%): $4,284
- Total Expenses: $21,784
NOI = $61,200 - $21,784 = $39,416
This $39,416 is the number you would take to the bank to qualify for a loan, or use to determine the purchase price based on market cap rates.
Using NOI to Find Property Value
Once you have the NOI, you can determine the property's market value using the Cap Rate formula:
If similar buildings in the neighborhood are selling at a 6% Cap Rate, then:
Value = $39,416 ÷ 0.06 = $656,933
This is why increasing NOI is so powerful. For every $1 you increase the NOI (by raising rent or cutting costs), you add $16.66 to the property's value (at a 6% cap rate).
Advanced NOI Scenarios: Pro-Forma vs. Actual
When analyzing a deal, you'll encounter two types of NOI. Knowing the difference protects you from bad investments.
1. Actual NOI (Trailing 12 Months)
This is historical reality. It's based on the P&Ls from the last year. It reflects how the current owner is running the building. Always ask for the "T-12" to verify this number.
2. Pro-Forma NOI (Projected)
This is the broker's or seller's "perfect world" scenario. It assumes market rents, lower vacancy, and efficient management. While useful for seeing potential upside, never buy based solely on pro-forma numbers without stress-testing them.
How to Spot "Fake" NOI
Sellers often inflate NOI to boost the sale price. Watch out for expenses that seem suspiciously low (e.g., $200/year for repairs on an old building) or missing items like management fees (if the owner manages it themselves). Always "normalize" the expenses to what YOU would pay.
Advanced Analysis: Spotting Trends in NOI
A single year's NOI tells you where you are today, but trailing NOI tells you where you are going. Professional analysts look at the CAGR (Compound Annual Growth Rate) of NOI over 3-5 years.
Scenario A: Rising NOI (Healthy)
Even if the market cap rate stays the same, if your NOI increases by 5% annually, your property value appreciates by 5% annually effectively. This is "forced appreciation" and is the holy grail of commercial real estate.
Scenario B: Flat or Declining NOI (Warning)
If revenue is rising but NOI is flat, your Expense Ratio is creeping up. This is a red flag. It means costs are eating your rent hikes. In 2025, insurance premiums and property taxes are the silent killers here. Always trend these two line items specifically.
3 Ways to Boost Your NOI
As an owner, your primary job is to maximize NOI. Here are three leverage points:
- Raise Revenue: Implement utility bill-back systems (RUBS), add covered parking fees, or renovate units to command higher market rents.
- Reduce Expenses: Contest property tax assessments, switch to LED lighting to lower common area electric bills, or sub-meter water usage.
- Minimize Vacancy: Improve tenant retention with responsive management. Turnover costs (painting, marketing, lost rent) are NOI killers.
Frequently Asked Questions
Is NOI calculated monthly or annually?▼
Should I include reserves for replacement in NOI?▼
How does vacancy affect NOI?▼
Can NOI be negative?▼
Why do lenders care about NOI?▼
What is the difference between NOI and EBIT?▼
How does inflation impact NOI?▼
Is NOI the same as tax-deductible operational profit?▼
About Marko Šinko
Marko is a CPA and commercial real estate analyst with over a decade of experience valuing multifamily and retail assets. He specializes in helping investors bridge the gap between financial theory and practical deal underwriting.