What Is Present Value of Annuity? (2025 Guide)
The Present Value of Annuity is a critical financial metric that determines the current worth of a series of future payments. In simple terms, it answers the question: "How much is that future stream of income worth to me today?"
This concept is the backbone of retirement planning, structured settlements, and investment valuation. Because money has a "time value"—meaning a dollar today is worth more than a dollar tomorrow due to its earning potential—future payments must be "discounted" back to the present to understand their true value.
Key Takeaway: If you are choosing between a lump sum of $100,000 today or $10,000 a year for 10 years, the lump sum is almost always the better mathematical choice. Why? Because you can invest that $100,000 immediately. Our calculator helps you quantify exactly how much better one option is over the other.
The Math Behind the Calculator
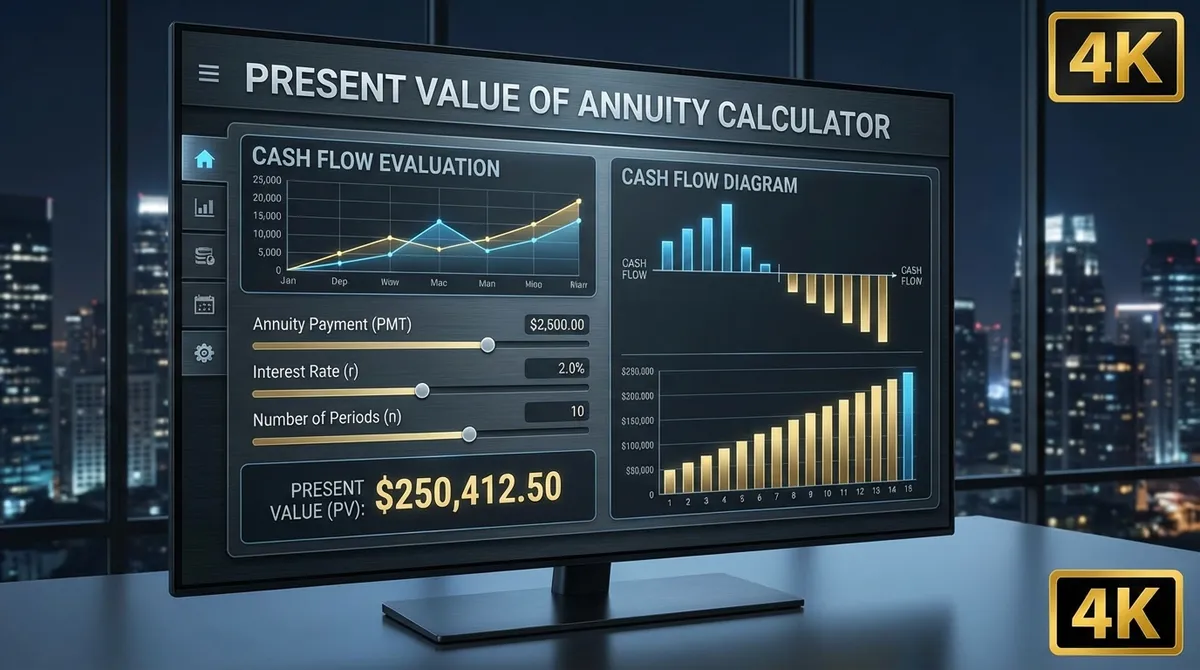
While our calculator handles the complex math instantly, understanding the formula helps you grasp the mechanics of your money. The standard formula for the Present Value of an Ordinary Annuity (where payments are made at the end of each period) is:
- •PMT (Payment): The amount of money paid or received in each period (e.g., $500/month).
- •r (Rate): The discount rate or interest rate per period. If the annual rate is 6% and payments are monthly, r = 0.06 / 12 = 0.005.
- •n (Number of Periods): The total number of payments. For a 5-year loan paid monthly, n = 5 × 12 = 60.
Ordinary Annuity vs. Annuity Due: What's the Difference?
The timing of the payment makes a mathematical difference. Payments received sooner are worth more.
| Feature | Ordinary Annuity | Annuity Due |
|---|---|---|
| Payment Timing | End of period (e.g., Mortgage, Loan) | Beginning of period (e.g., Rent, Lease) |
| Present Value | Lower | Higher (multiplied by 1+r) |
| Common Use Case | Most consumer loans & bonds | Insurance premiums & Rents |
Factors That Move the Needle
The Present Value of an Annuity is highly sensitive to three main variables. Understanding how they interact helps you negotiate better deals.
1. Discount Rate
The most powerful lever. A higher discount rate drastically lowers the present value.
$1000/yr for 10 yrs:
@ 3% = $8,530
@ 8% = $6,710
2. Term Length
Longer terms increase value, but with diminishing returns due to discounting.
Payments in year 30 are worth very little today compared to payments in year 1.
3. Payment Frequency
More frequent payments (monthly vs. annual) slightly increase the value due to faster reinvestment.
Monthly compounding > Annual compounding.
Real-World Scenario: The Lottery Dilemma
Imagine you've won a lottery prize. You are presented with two options:
Option A: The Annuity
Receive $10,000 per year for 20 years.
Total Payout: $200,000
Option B: Lump Sum
Receive a one-time payment of $130,000 today.
Total Payout: $130,000
At first glance, Option A looks better ($200k vs $130k). But let's apply the Present Value concept. If you could invest that lump sum at a conservative 5% annual return, what is Option A actually worth in today's dollars?
The Verdict: Using our calculator, the Present Value of $10,000/year for 20 years at 5% is approximately $124,622.
Since the Lump Sum offer ($130,000) is higher than the Present Value ($124,622), Option B is mathematically superior. You could take the $130k, invest it at 5%, and end up with more than the annuity would have provided.
Deep Dive: Selling a Structured Settlement
One of the most common real-world uses for this calculator is by people who are receiving payments from a lawsuit settlement or insurance claim and want to sell them for immediate cash (e.g., to companies like J.G. Wentworth).
The "Factoring Discount" Trap
If you have a settlement paying $2,000/month for 10 years (Total: $240,000), a buyout company might offer you $150,000 cash. Is that fair?
- Step 1: Use the calculator. Set PMT=$2,000, n=120 months.
- Step 2: Set Rate = 3% (Conservative risk-free rate). Result: $205,000.
- Step 3: Compare. The offer ($150,000) is $55,000 less than the fair PV.
By accepting $150,000, you are effectively paying an implicit interest rate of roughly 10-12% to the factoring company. Always run the numbers!
Common Calculation Mistakes
Mistake #1: Mismatched Rates and Periods
The most common error is using an annual interest rate with monthly periods without converting.
Solution: If your payments are monthly, you must divide your annual rate by 12. Our calculator handles this automatically when you select the "Payment Frequency."
Mistake #2: Confusing "Ordinary" vs. "Due"
Timing matters. Payments made at the start of the month (Annuity Due) are worth more than payments at the end (Ordinary Annuity) because they have less time to be discounted.
Solution: For loans, it's usually "Ordinary" (end). For leases and rent, it's usually "Due" (beginning).
Strategic Applications for 2025
Retirement Planning
Use this to calculate how much of a "nest egg" you need today to generate a specific monthly income for 20 or 30 years using our retirement calculator.
Business Valuation
Value a business based on its projected future cash flows. This is the core of "Discounted Cash Flow" (DCF) analysis.
Loan Analysis
Determine the "fair value" of a loan or mortgage note if you were to sell it to an investor.
Legal Settlements
Compare lump-sum settlement offers against structured payment plans to ensure you aren't being shortchanged.
Deep Dive: Types of Annuities and Their Valuation
Not all annuities are created equal. The type of annuity you have significantly impacts how you should value it.
Fixed Annuity
The simplest form. You receive a guaranteed dollar amount for a set period. Valuation is straightforward using the standard formula.
Risk Profile: Low. Vulnerable to inflation risk.
Variable Annuity
Payouts fluctuate based on the performance of underlying investments (like mutual funds). Valuing these is complex because the "PMT" (payment) variable changes.
Risk Profile: High. Offers growth potential but payments can decrease.
Indexed Annuity
Returns are tied to a market index (like the S&P 500) but usually with a "floor" to prevent losses and a "cap" on gains.
Risk Profile: Moderate. A middle ground between fixed and variable.
The Tax Factor: Gross vs. Net Value
A common mistake is ignoring taxes. If your annuity comes from a Pre-Tax source (like a Traditional 401(k) or IRA), every dollar you receive is taxed as ordinary income.
- Lump Sum: If you take a large lump sum, you might push yourself into the highest tax bracket for that year, losing 37%+ to the IRS.
- Annuity Stream: Spreading payments out keeps your taxable income lower each year, potentially keeping you in a 12% or 22% bracket.
Always calculate the "After-Tax Present Value" for a true comparison.
Frequently Asked Questions
Does this calculator work for lottery winnings?
What discount rate should I use?
What is the difference between Future Value and Present Value?
Can Present Value be negative?
How does inflation affect the calculation?
What is a Perpetuity vs. an Annuity?
Final Thoughts
The Present Value of Annuity is a powerful tool that cuts through the noise of large future numbers and tells you what they are really worth right now. By using this calculator, you can negotiate better deals, plan a more secure retirement, and make investment choices with mathematical confidence.
Ready to run your numbers? Scroll up to the calculator and start planning your financial future.