Complete Guide: Quick Ratio (Acid Test) Analysis
In today's volatile business environment, understanding your company's liquidity position isn't just good practice—it's survival. The quick ratio, also known as the acid test ratio, provides a stringent assessment of your ability to meet short-term obligations without relying on inventory sales.
What Is the Quick Ratio?
The quick ratio is a financial metric that measures a company's ability to meet its short-term obligations using its most liquid assets. Unlike the current ratio, which includes all current assets, the quick ratio excludes inventory and other less liquid assets, providing a more conservative view of liquidity.
Think of it as a financial stress test: if all your short-term debts came due tomorrow, could you pay them without selling inventory? This ratio (also known as the acid test) answers that question definitively.
Key Takeaway
A quick ratio above 1.0 indicates your business can cover all short-term liabilities with liquid assets alone. Below 1.0 suggests potential liquidity challenges that require immediate attention.
What's Included in Quick Assets?
Quick assets include only the most liquid current assets that can be converted to cash within 90 days:
- Cash: Physical currency, bank account balances, and demand deposits
- Cash Equivalents: Treasury bills, money market funds, and short-term government bonds
- Marketable Securities: Stocks, bonds, and other investments that can be sold quickly
- Accounts Receivable: Money owed by customers for goods/services already delivered
What's Excluded from Quick Assets?
These assets are deliberately excluded because they cannot be reliably converted to cash within 90 days:
- Inventory: Raw materials, work-in-progress, and finished goods
- Prepaid Expenses: Insurance, rent, or other payments made in advance
- Equipment and Long-term Assets: Property, plant, and equipment
- Intangible Assets: Patents, trademarks, and goodwill
Why Exclude Inventory?
Inventory is excluded because its conversion to cash is uncertain. During economic downturns or industry-specific challenges, inventory may require steep discounts to sell, or may not sell at all. The quick ratio provides a "worst-case scenario" assessment by ignoring inventory entirely.
The Quick Ratio Formula Explained
The quick ratio formula is straightforward but powerful:
Component Definitions:
- Cash: All liquid cash in checking, savings, and money market accounts
- Cash Equivalents: Investments maturing within 90 days with minimal risk
- Marketable Securities: Publicly traded stocks and bonds that can be sold quickly
- Accounts Receivable: Money customers owe for products/services delivered
- Current Liabilities: Debts and obligations due within one year
Step-by-Step Calculation Example
Let's walk through a practical example using a small manufacturing company:
Company ABC Balance Sheet (Current Assets & Liabilities)
Quick Assets:
- • Cash: $50,000
- • Cash Equivalents (T-bills): $25,000
- • Marketable Securities: $15,000
- • Accounts Receivable: $30,000
- Total Quick Assets: $120,000
Current Liabilities:
- • Accounts Payable: $40,000
- • Short-term Debt: $25,000
- • Accrued Expenses: $15,000
- Total Current Liabilities: $80,000
Calculation:
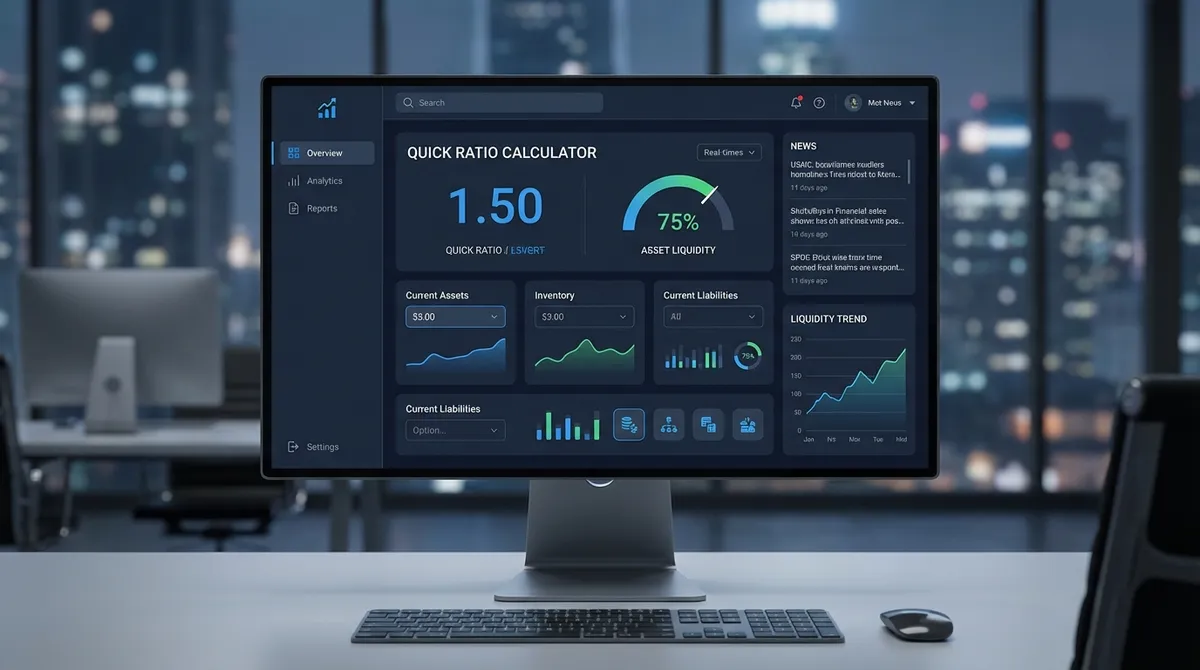
Quick Ratio = $120,000 ÷ $80,000 = 1.5x
Interpretation
With a quick ratio of 1.5x, Company ABC has $1.50 in liquid assets for every $1.00 in short-term liabilities. This is a strong liquidity position indicating the company can comfortably meet its short-term obligations.
Understanding Quick Ratio Results
Interpreting your quick ratio requires context about your industry, business model, and growth stage:
Quick Ratio Above 1.0 (Strong Liquidity)
A ratio above 1.0 indicates your company can pay all short-term liabilities with liquid assets. However, an excessively high ratio may suggest:
- Excess cash that could be invested in growth
- Missed opportunities for expansion
- Ultra-conservative financial management
Quick Ratio Between 0.5 and 1.0 (Moderate Liquidity)
This range is common and often acceptable depending on your industry:
- Company can cover 50-100% of liabilities with liquid assets
- May rely on inventory sales for remaining obligations
- Requires careful cash flow management
- Typical for retail, manufacturing, and inventory-heavy businesses
Quick Ratio Below 0.5 (Weak Liquidity)
A ratio below 0.5 signals potential liquidity challenges:
- Company cannot cover half of short-term obligations with liquid assets
- High risk of cash flow problems
- May struggle during economic downturns
- Requires immediate attention and corrective action
Industry Benchmarks and Variations
What's considered a "healthy" quick ratio varies significantly by industry:
Industry-Specific Guidelines:
- Technology/Software: 1.5-3.0x (low inventory, high cash reserves)
- Manufacturing: 0.8-1.2x (moderate inventory needs)
- Retail: 0.2-0.5x (heavy inventory reliance is normal)
- Financial Services: 1.0-2.0x (regulated liquidity requirements)
- Healthcare: 1.0-1.5x (steady cash flow, moderate inventory)
- Construction: 0.8-1.2x (project-based cash flows)
- Restaurants: 0.3-0.7x (high inventory turnover, cash business)
Why Industry Matters
A retail business with a 0.4x quick ratio might be perfectly healthy due to rapid inventory turnover, while a software company with the same ratio would be in serious financial distress. Always compare your ratio to industry peers and track trends over time.
Common Mistakes When Using the Quick Ratio
1. Including Inventory in Quick Assets
The most common mistake is treating the quick ratio like the current ratio. Remember: inventory is explicitly excluded because its conversion to cash is uncertain.
2. Using Stale Data
Balance sheet values change constantly. Using month-old data for a rapidly growing company can give a false sense of security or unnecessary alarm.
3. Ignoring Accounts Receivable Quality
Not all accounts receivable are equally collectible. If 20% of your AR is over 90 days old, your true quick ratio is lower than calculated. Check your working capital to be sure.
4. Comparing Across Different Industries
A manufacturing company's 0.8x ratio might be healthier than a tech company's 1.2x depending on industry norms and business models.
5. Treating It as a Standalone Metric
The quick ratio should never be used in isolation. Combine it with current ratio, cash flow analysis, and other financial metrics for a complete picture.
Strategies to Improve Your Quick Ratio
If your quick ratio needs improvement, here are proven strategies:
1. Accelerate Accounts Receivable Collection
- Implement stricter credit policies
- Offer early payment discounts (e.g., 2/10 net 30)
- Use invoice factoring for immediate cash
- Automate invoicing and follow-up processes
2. Increase Cash Reserves
- Reduce unnecessary expenses
- Improve profit margins through pricing optimization
- Sell non-essential assets
- Secure a line of credit before it's needed
3. Reduce Current Liabilities
- Negotiate longer payment terms with suppliers
- Convert short-term debt to long-term debt
- Pay bills strategically to optimize cash flow
- Reduce reliance on short-term financing
4. Invest Excess Cash Wisely
If your ratio is too high, put that cash to work:
- Invest in growth opportunities
- Expand into new markets
- Research and development
- Return capital to shareholders through dividends
- Share buyback programs
Factors That Affect Your Quick Ratio
Several internal and external factors influence your quick ratio:
Internal Factors:
- Seasonal Business Cycles: Retailers may see ratios fluctuate dramatically during holiday seasons
- Growth Stage: Rapidly growing companies often have lower ratios due to investment in expansion
- Management Decisions: Cash management policies, credit terms, and investment strategies
- Business Model: Subscription businesses often have more predictable cash flows
External Factors:
- Economic Conditions: Recessions affect customer payment patterns and credit availability
- Industry Trends: Changes in industry payment cycles and credit terms
- Interest Rates: Affect the attractiveness of holding cash vs. investing
- Regulatory Environment: Some industries have mandated liquidity requirements
Real-World Examples
Example 1: Tech Startup (Software)
Balance Sheet:
- • Cash: $500,000
- • Accounts Receivable: $150,000
- • Current Liabilities: $200,000
Quick Ratio: $650,000 ÷ $200,000 = 3.25x
Interpretation: Excellent liquidity, but potentially holding too much cash that could be invested in growth.
Example 2: Manufacturing Company
Balance Sheet:
- • Cash: $100,000
- • Accounts Receivable: $300,000
- • Current Liabilities: $350,000
Quick Ratio: $400,000 ÷ $350,000 = 1.14x
Interpretation: Healthy liquidity position typical for manufacturing with $1.14 in liquid assets for every $1 in short-term obligations.
Example 3: Restaurant Chain
Balance Sheet:
- • Cash: $50,000
- • Accounts Receivable: $20,000
- • Current Liabilities: $180,000
Quick Ratio: $70,000 ÷ $180,000 = 0.39x
Interpretation: Low ratio but not necessarily problematic for restaurants that turn inventory quickly and generate daily cash from sales.
Advanced Considerations
The Conservative Quick Ratio
An even more stringent version excludes accounts receivable:
This ratio assumes accounts receivable may not be collectible within 90 days, providing an ultra-conservative liquidity assessment.
Quick Ratio vs. Current Ratio
| Aspect | Quick Ratio | Current Ratio |
|---|---|---|
| Formula | Excludes inventory | Includes all current assets |
| Conservatism | Very conservative | Moderately conservative |
| Best Use | Crisis/"worst case" scenarios | Normal operations |
Trend Analysis
A single ratio provides limited insight. Track your quick ratio over time to identify:
- Improving Trend: Ratio increasing over 6-12 months indicates strengthening liquidity
- Declining Trend: Ratio decreasing suggests emerging liquidity challenges
- Cyclical Patterns: Seasonal businesses will see predictable fluctuations
- Inflection Points: Sudden changes may indicate business model shifts or problems
Key Takeaways
- ✓Quick Ratio = (Cash + Cash Equivalents + Marketable Securities + Accounts Receivable) ÷ Current Liabilities
- ✓Above 1.0 = Strong liquidity; Below 0.5 = Potential challenges
- ✓Industry context matters - compare to peers, not arbitrary benchmarks
- ✓Trend analysis reveals more than a single snapshot
- ✓Combine with other metrics for comprehensive financial analysis
Next Steps
Take Action Today:
- Calculate Your Current Ratio: Use our calculator above to establish your baseline
- Compare to Industry Peers: Research typical ratios in your industry
- Track Monthly: Monitor your ratio over time to identify trends
- Develop Action Plans: Create strategies to improve or optimize your ratio
- Combine with Other Analysis: Use alongside cash flow statements and current ratio
Remember: The quick ratio is your financial early warning system. A healthy ratio provides peace of mind and financial flexibility to weather economic storms. Use our calculator regularly to stay on top of your business's liquidity position and make informed financial decisions.